Metabase
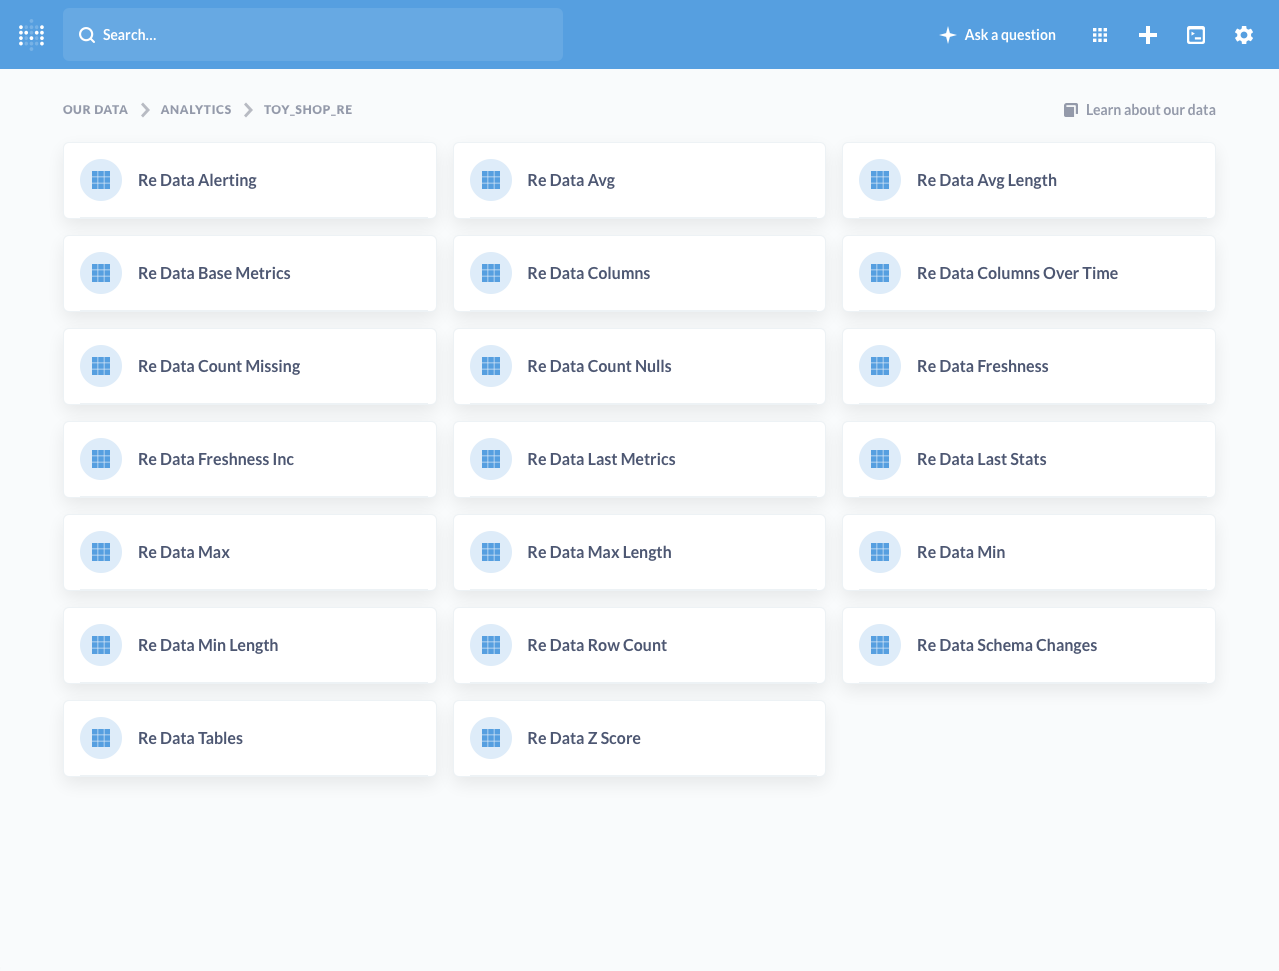
All created tables#
Let's look into an example for our tutorial toy_shop data, we can find all stats computed for toy_shop in toy_shop_re schema
Let's investigate rows counts#
Let's say we want to look into row counts metrics. (From the toy_shop example there were problems with someday missing orders items)
We set up a visualization for Re Data Row Count items in Metabase. Here is how it looks like:
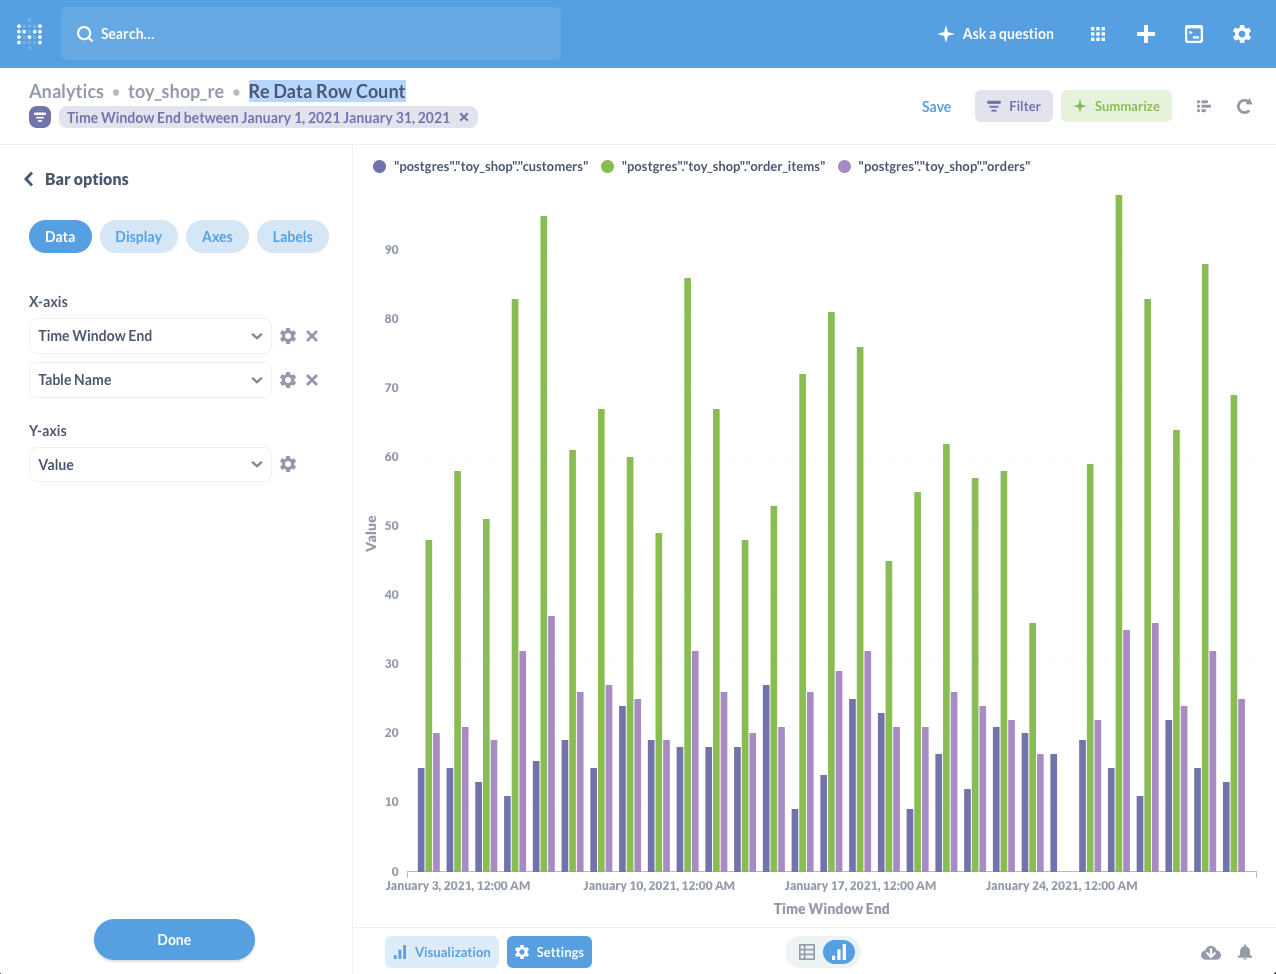
If we remember the issue in our example, or if we look closely enough on a diagram we can see the potential problems here. Data around 24 January on a chart is missing order_items and orders, we only have customers for this day, which is really suspicious.
When running re_data reguarly we should be able detect this kind of problems when they happen.
If we are happy with visualization it's best to save it so that and later on use it or add it to your dashboard.
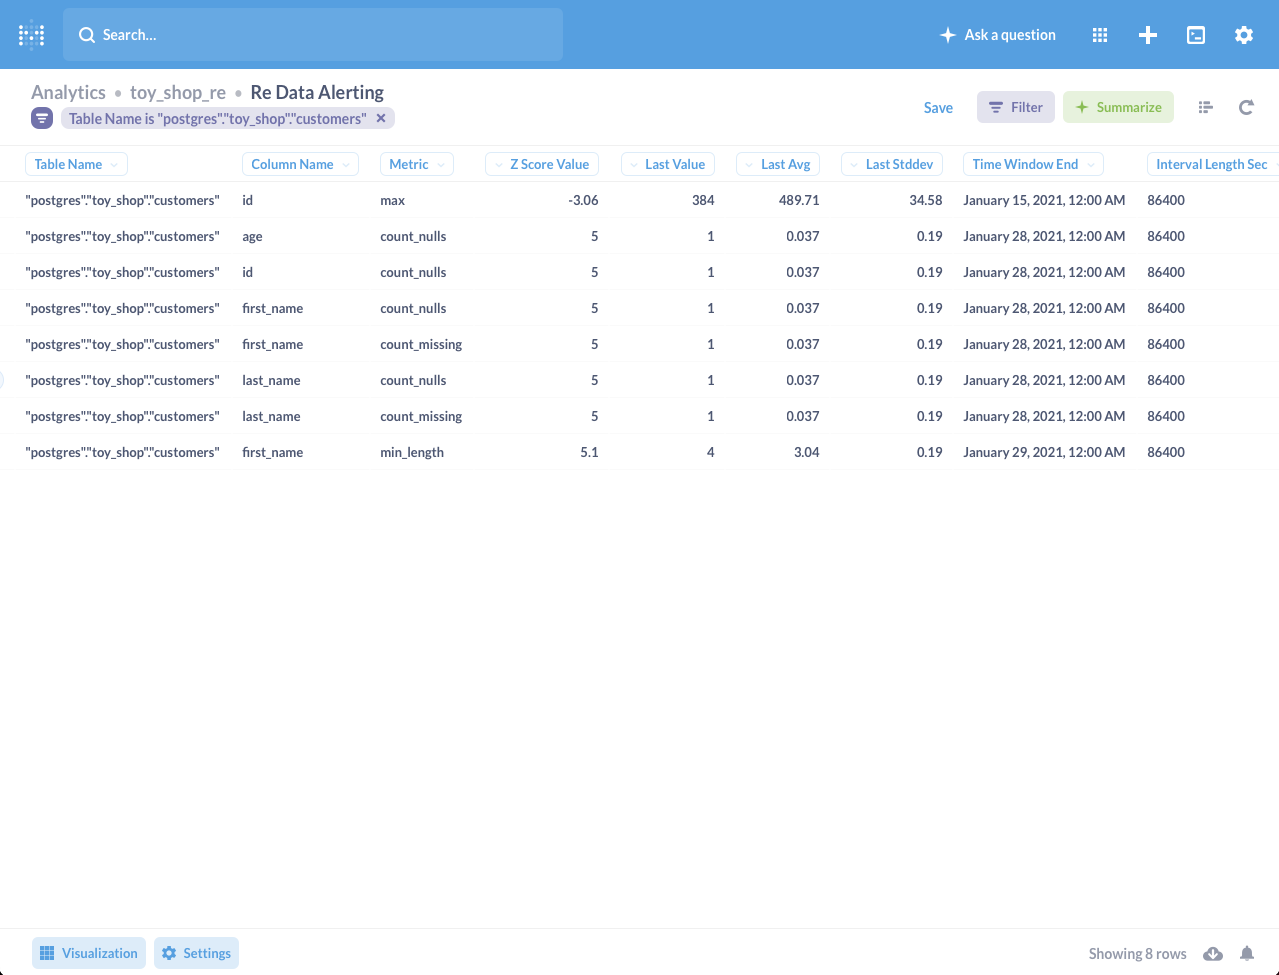
Alerts in the customers table#
Now, let's look into alerts for a specific table: customers. It looks like we have an alert on a null count in the last_name and first_name column of customers.
Quick check into our actual data confirms that we have invalid data added to our table:
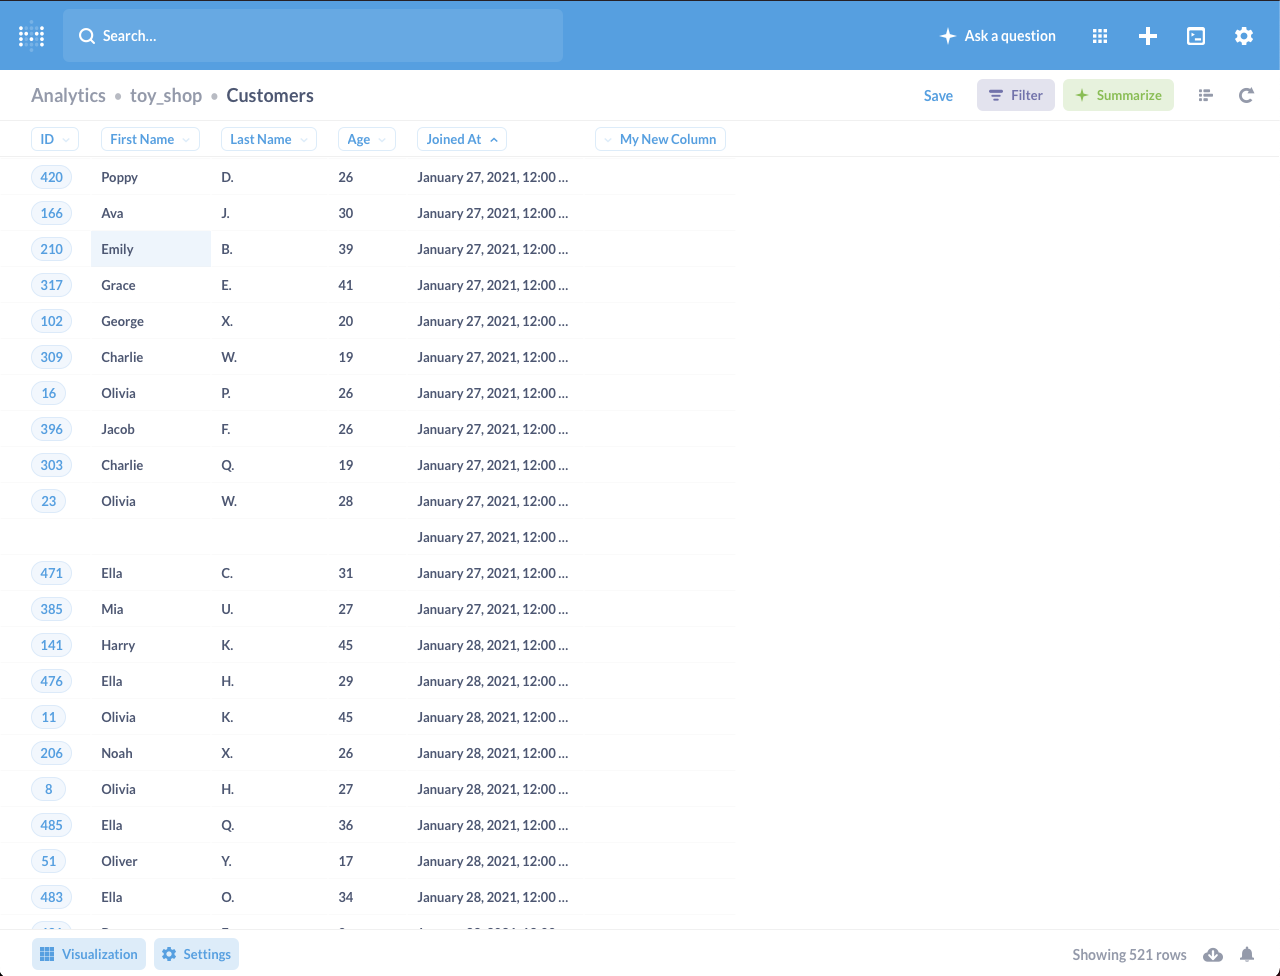
Notice, that with re_data stats it's easy to go back and forth from actual data, when investigating problems & anomalies.
Composing health dashboard#
Let's just compose couple of Questions (in Metabase sense) to create a simple dashboard describing system health.
Those are things we would like to add to our dashboard:
- Numbers of rows in our tables
- Freshness of data
- All recent alerts from our tables
- All recent schema changes
Here is how it looks like:
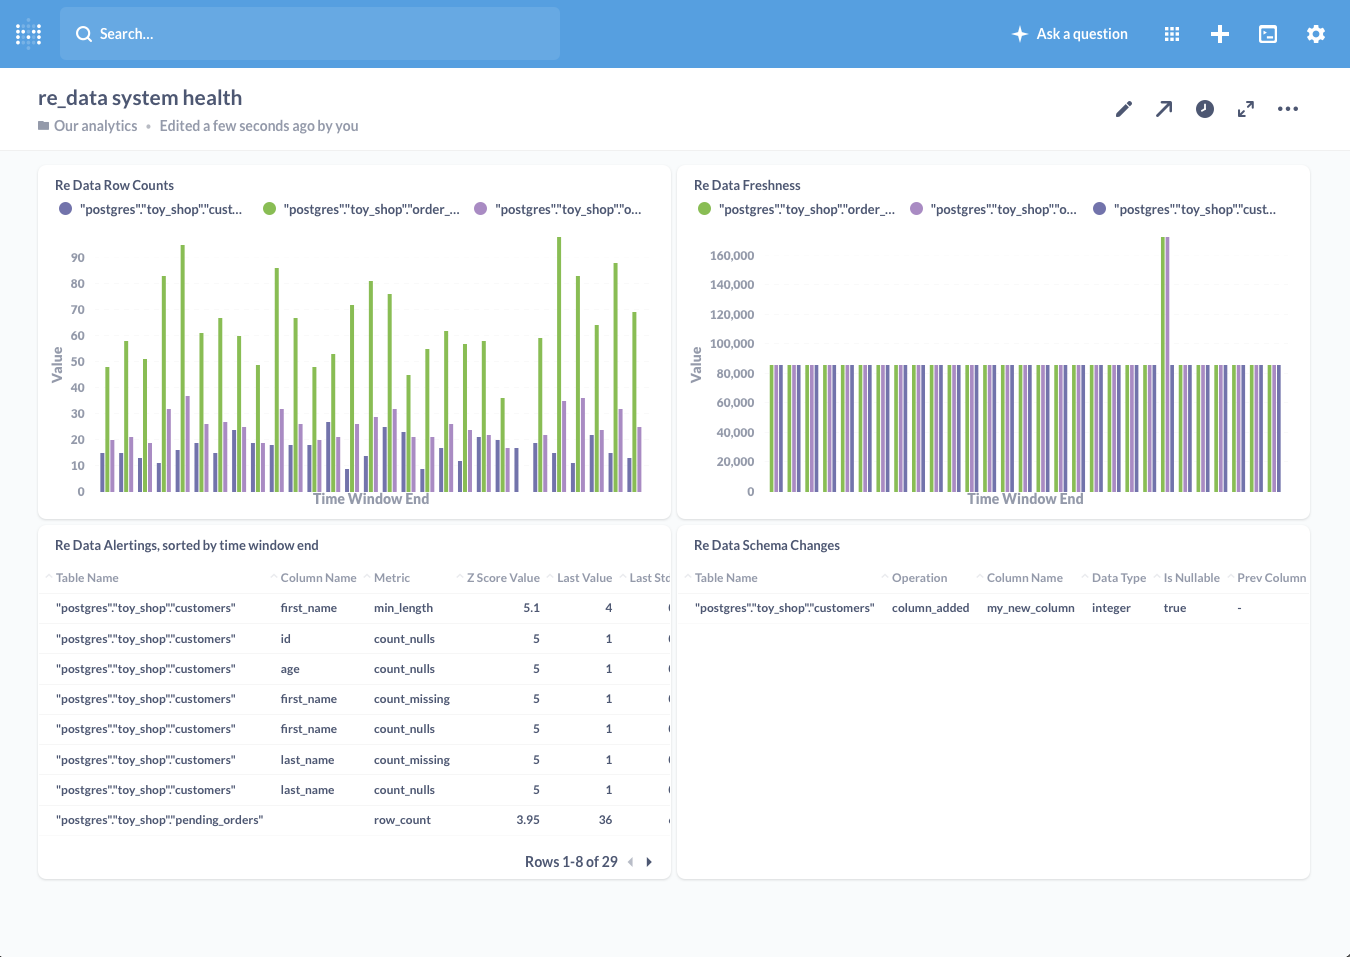
It's quite a simple dashboard but shows how you can interact with metrics computed by re_data.
info
For freshness visualization, if it looks strangely linear to you, that is expected, at least that's how data was generated 🙂
Your BI#
If you would like to see any other example of BI dashboard (Looker, Tableau, Superset, etc.) or you have your setup which you would like to share with the world, let us know on Slack! 😊